

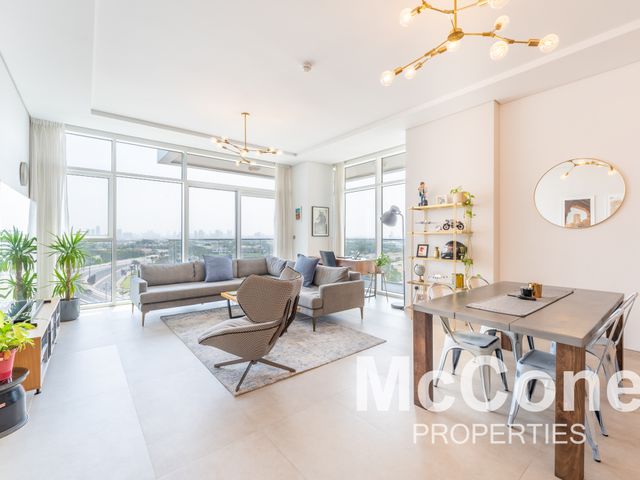
AED 3,999,999
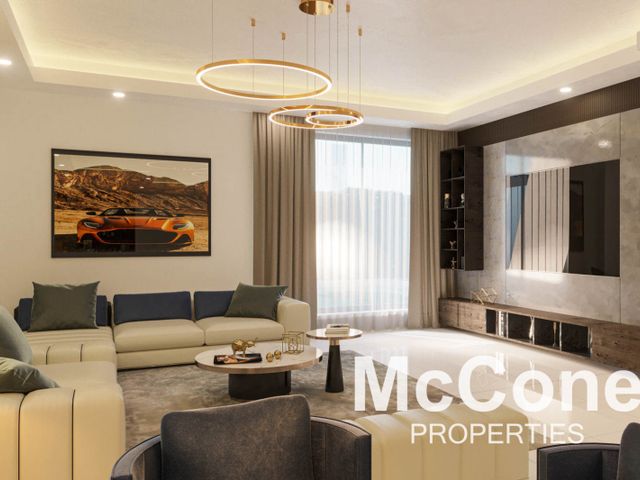
2 bedroom apartment in Banyan Tree Residences Hillside Dubai
3 bath · 1,455 sqft · Corner Unit · Exclusive · Spacious · Resort-Style

Community · Dubai
Jumeirah Lake Towers is the Marina's plainer neighbour across the highway, and for many people the better deal.
On the market · Jumeirah Lake Towers
5 homes
AED 3,999,999
3 bath · 1,455 sqft · Corner Unit · Exclusive · Spacious · Resort-Style
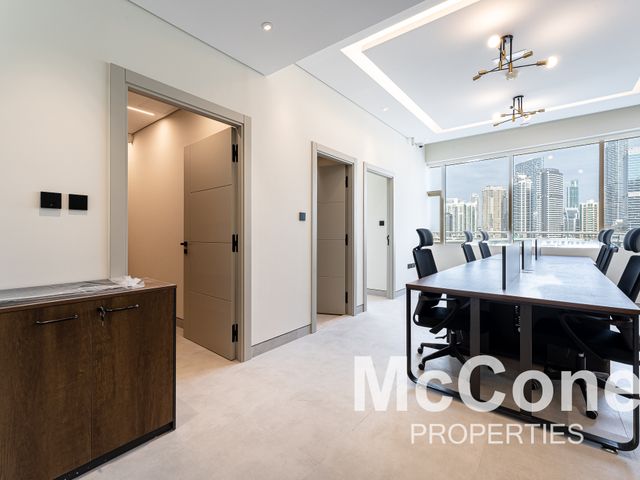
AED 2,367,800
0 bath · 1,005 sqft · Fully Fitted · High ROI · Leased Till 2027
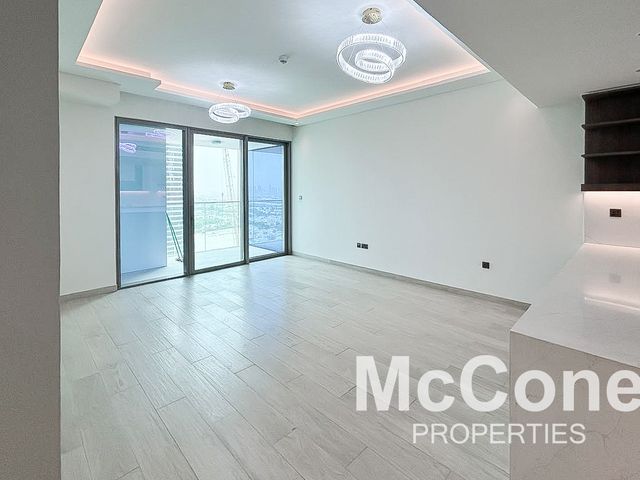
AED 1,849,999
2 bath · 820 sqft · Meadows Views · Huge + Storage · Prime Location
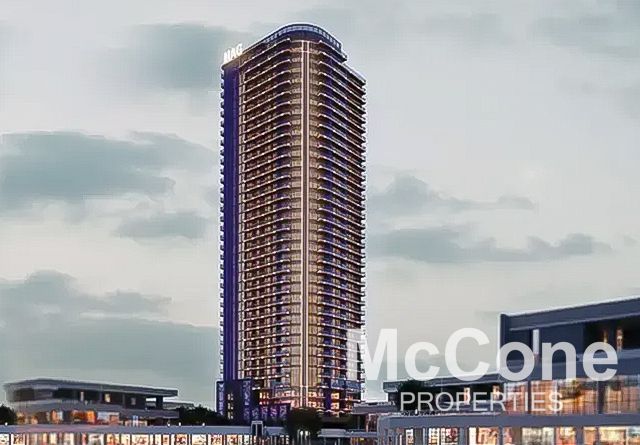
AED 1,380,000
1 bath · 590 sqft · Fully Furnished · Metro Nearby · Handover Q1 2027
AED 940,000
1 bath · 407 sqft · PHPP · Stunning Lake View · High Floor
The area
Jumeirah Lake Towers is the Marina's plainer neighbour across the highway, and for many people the better deal. A free zone laid out its towers in lettered clusters around three lakes, mixing offices and homes in the same buildings and the same streets, and the result is a dense, walkable, slightly untidy district with two Metro stations, a great many restaurants, and flats that cost less than the same view on the other side of Sheikh Zayed Road. JLT stands for Jumeirah Lakes Towers, plural in the free zone's own usage though half the city writes Lake, and the district is named for the Jumeirah coast rather than on it.
The district sits on the inland side of Sheikh Zayed Road opposite the Marina, with Jumeirah Islands and Jumeirah Park behind it. Its towers stand in clusters of three around the lakes, each cluster known by a letter, with a promenade around the water, parks at the lakes' ends and retail at the towers' feet. Some clusters are residential, some are offices, most are both, and the character of a cluster depends on its mix. The two Metro stations on its highway edge, which now carry sponsors' names, are the district's great practical asset.
Apartments only, from studios to large penthouses, in towers that range from the district's first, plainly built, to newer ones of real quality. The differences between towers are large: in finish, in management, in whether the building is mostly homes or mostly offices, and in whether it faces the lake, the Marina skyline or the highway. Service charges vary widely and the register records the spread in what the towers' flats have fetched.
Professionals who work in the free zone or the Marina and want to walk to the desk and the train. Tenants who want the Marina's life at a lower rent. Investors, for whom the district's yields have long beaten its neighbour's. Families who want a large flat near the schools of the Meadows and the Springs.
By building

Banyan Tree Residences Hillside Dubai
A home for sale →

HDS Business Centre
A home for sale →

MBL Signature
A home for sale →

Me Do Re 2
A home for sale →

Viewz 2 by Danube
A home for sale →
And the rest

Your agent in Jumeirah Lake Towers
Senior Sales
Reece is marketing 2 homes for sale in Jumeirah Lake Towers right now.