
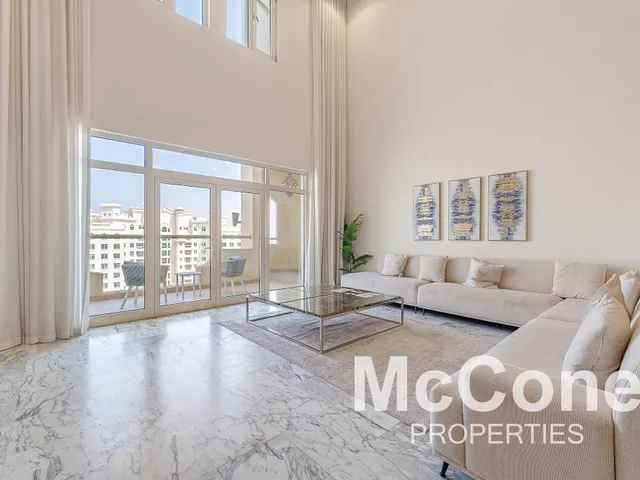
AED 10,500,000
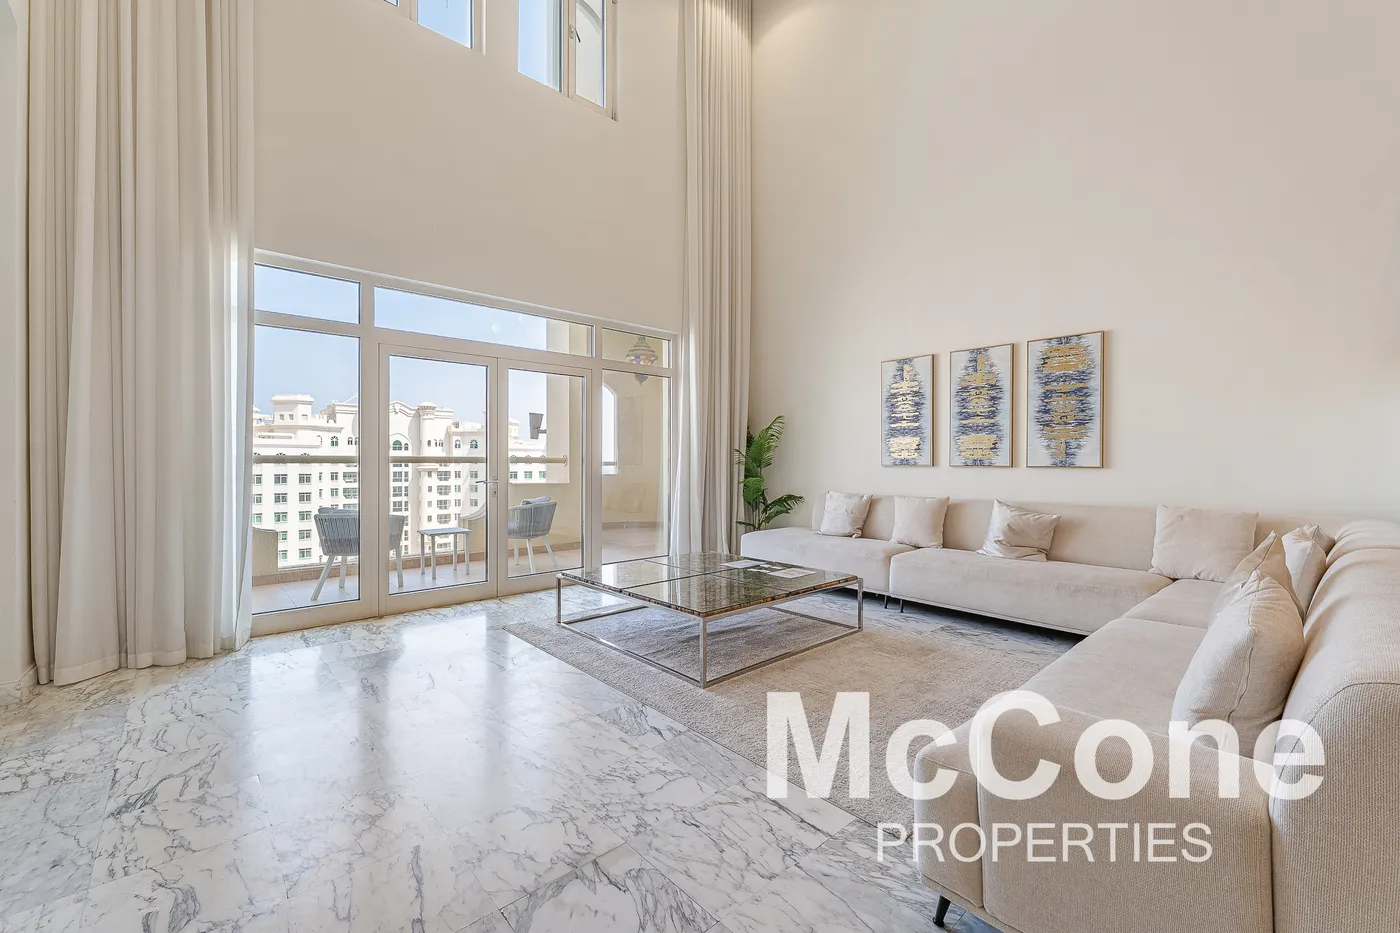
4 bedroom penthouse in Al Shahla
5 bath · 4,900 sqft · Vacant · Duplex Penthouse · Partial Sea Views
What people actually paid in Al Shahla: the sales registered at the Dubai Land Department, not asking prices. Understand the numbers before you buy.
On the market · Al Shahla
1 home
Al Shahla — 15 sales in the last 12 months, median AED 4.05M at AED 2,244 a sq ft, from the DLD register. 1 for sale with McCone.
Your agent in Palm Jumeirah

Secondary Director
Buying in Al Shahla? Chris can walk you through what these numbers mean for you.
Chris is marketing 5 homes for sale in Palm Jumeirah right now.
Recorded rents and gross yield for Al Shahla →
How Al Shahla compares — every tower in Palm Jumeirah, ranked by recorded price →
Living in Palm Jumeirah — the area guide →
What a mortgage on a home in Al Shahla costs a month — and the cash you need on the day →
The recorded market
The median of every sale registered at the Dubai Land Department here. Not asking prices.
The low was 2020 at AED 801 a square foot, and it has recovered 181% since. It is still 0% below its 2025 peak.
What sells here
Registered sales in the last three years. Sizes are the registered floor area.
| Layout | Typical size | Median price | Mean price | Per sq ft | Sales |
|---|---|---|---|---|---|
| 1 B/R | 1,145 sqft | 2,620,000 | 2,555,500 | 2,215 | 10 |
| 2 B/R | 1,586 sqft | 3,480,000 | 3,476,667 | 2,160 | 15 |
| 3 B/R | 2,172 sqft | 4,750,000 | 4,673,934 | 2,170 | 14 |
Layouts that have sold fewer than five times in three years are left out — too few to quote a median, so we do not guess at one.
Every sale, as registered
The last transfers recorded at the Dubai Land Department, newest first.
| Date | Layout | Size | Price | Per sq ft |
|---|---|---|---|---|
| 8 Oct 2026 | 2 B/R | 1,551 | 4,175,000 | 2,692 |
| 31 Aug 2026 | 1 B/R | 1,145 | 2,590,000 | 2,263 |
| 11 Aug 2026 | 2 B/R | 1,551 | 3,480,000 | 2,244 |
| 5 Aug 2026 | 3 B/R | 2,187 | 4,999,999 | 2,286 |
| 23 Jul 2026 | 1 B/R | 1,145 | 2,775,000 | 2,424 |
| 19 Jun 2026 | 1 B/R | 1,145 | 2,480,000 | 2,167 |
| 5 Jun 2026 | 3 B/R | 2,241 | 4,700,000 | 2,097 |
| 5 Jun 2026 | 3 B/R | 2,142 | 4,800,000 | 2,241 |
| 23 Apr 2026 | 3 B/R | 2,223 | 4,750,000 | 2,137 |
| 21 Apr 2026 | 1 B/R | 1,145 | 3,100,000 | 2,708 |
| 8 Apr 2026 | 2 B/R | 1,589 | 4,055,000 | 2,552 |
| 26 Feb 2026 | 2 B/R | 1,603 | 3,550,000 | 2,215 |
How often it trades
Off-plan sales dominate a building’s first years; resales take over after handover.Off-planResale
Of the 265 sales on record, 0 were bought off-plan from the developer and 265 were resales of a finished home. The 2026 bar is part-year.
In context
Al Shahla is the 16th most expensive of the 19 Palm Jumeirah buildings with at least fifteen recorded sales in the last year. These are its immediate neighbours on price.
| Rank | Building | Sales, 12 months | Median per sq ft |
|---|---|---|---|
| 13 | The Fairmont Palm Residence North | 18 | 2,865 |
| 14 | The Fairmont Palm Residence South | 18 | 2,749 |
| 15 | Royal Amwaj Residences North | 24 | 2,375 |
| 16 | Al Shahla | 15 | 2,244 |
| 17 | Marina Residences 4 | 18 | 2,182 |
| 18 | Kempinski Palm Residence | 15 | 2,176 |
| 19 | Taj Grandeur Residences | 15 | 1,961 |
Palm Jumeirah as a whole: AED 3,593 a square foot across 1,057 sales in the last twelve months.
Where the market is moving
Al Shahla ranks 6th of the 8 Palm Jumeirah buildings with five or more completed-home sales in the ninety days to 19 Oct 2026. These are the five ahead of it, and its own row.
| Rank | Building | Sales, 90 days | Against its usual pace |
|---|---|---|---|
| 1 | Serenia Living Tower 1 | 14 | 11.2× |
| 2 | The Fairmont Palm Residence North | 8 | 1.9× |
| 3 | Al Sarrood | 7 | 4.0× |
| 4 | Seven Palm | 7 | 0.5× |
| 5 | Serenia Living Tower 2 | 6 | 6.0× |
| 6 | Al Shahla | 5 | 1.4× |
Completed homes only, by the date the Dubai Land Department registered the transfer — the ninety days to 19 Oct 2026. Buildings with fewer than five sales in the window are not ranked. The ten busiest in Palm Jumeirah, with pace against each building’s own year before.
Nearby
The buildings this one sits between on recorded price per square foot, and the newest to start trading. Every one has its own page of registered prices.
| Building | Recorded sales | First traded | Median per sq ft |
|---|---|---|---|
| Passo by Beyond - TOWER Bnewest | 86 | 2026 | 6,022 |
| Passo by Beyond - TOWER Anewest | 192 | 2025 | 5,822 |
| Al Msalli | 256 | 2009 | 1,275 |
| Al Khudrawi | 264 | 2009 | 1,228 |
| Al Hatimi | 240 | 2009 | 1,154 |
| Jash Hamad - B18 | 216 | 2012 | 1,152 |
| Al Haseer | 292 | 2009 | 1,123 |
| Al Hamri | 265 | 2009 | 1,073 |
| Golden Mile 7 | 167 | 2004 | 1,056 |
| Golden Mile 8 | 185 | 2004 | 1,050 |
Medians over each building’s whole recorded history at the Dubai Land Department, so a tower that has not traded lately is still here — this is what to look at next, not what the market is doing this month. Buildings with fewer than five recorded sales are left out. “First traded” is the year the register first saw a sale in the building, which for a new tower is close to its handover.
Buying in Al Shahla? The cost of buying, the title deed, the service charges and buying as a foreigner, explained.