
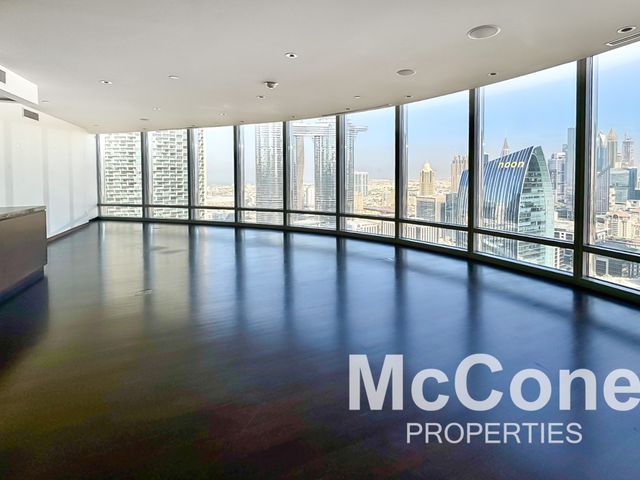
AED 540,000/ year
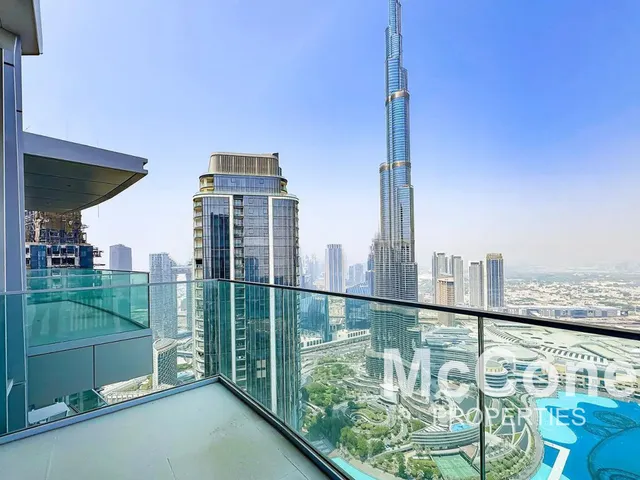
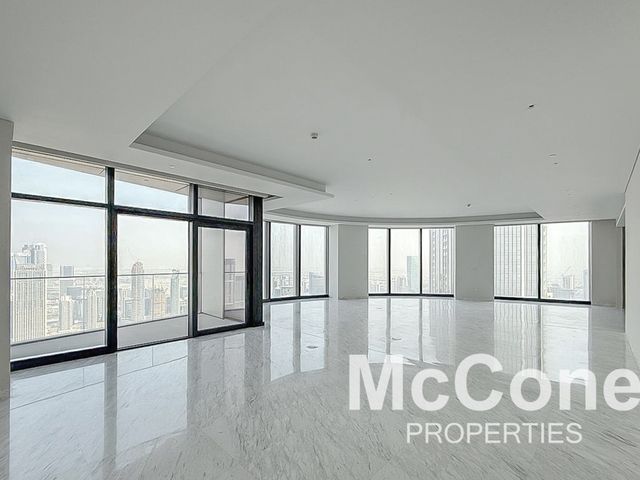
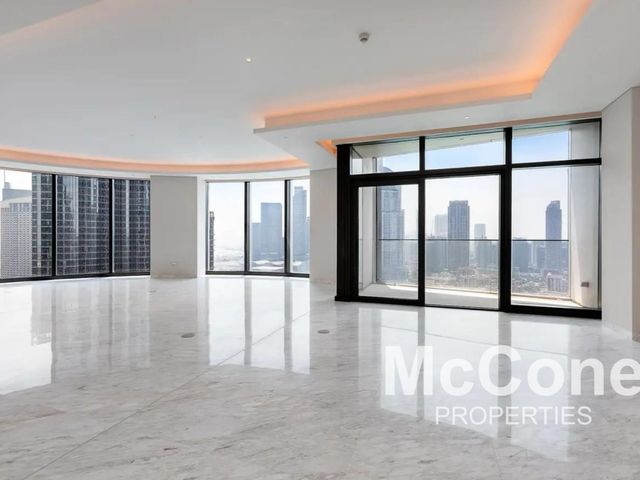
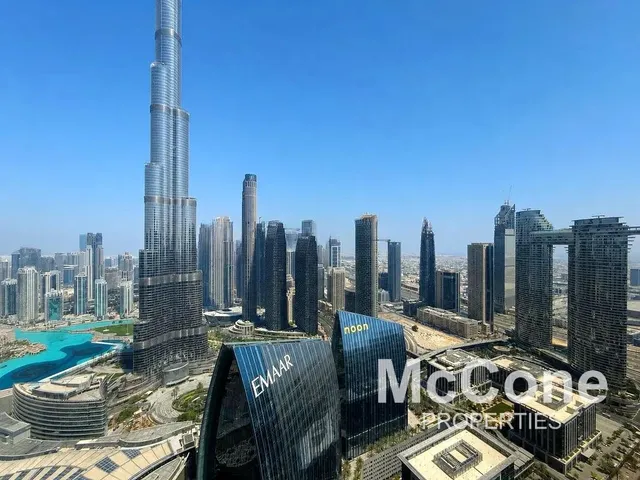
3 bedroom apartment in Burj Khalifa
4 bath · 2,333 sqft · Luxurious · Community View · Spacious
What tenants actually pay: the tenancies registered with Ejari, not asking rents. Understand the numbers before you rent.
On the market · Burj Khalifa
9 homes
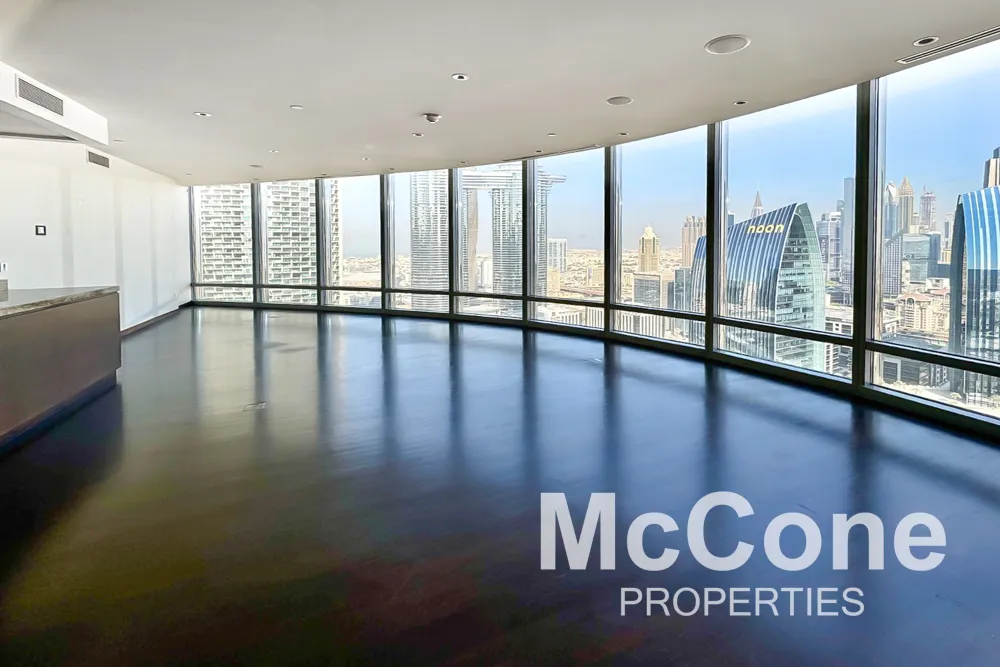
AED 540,000/ year
4 bath · 2,333 sqft · Luxurious · Community View · Spacious
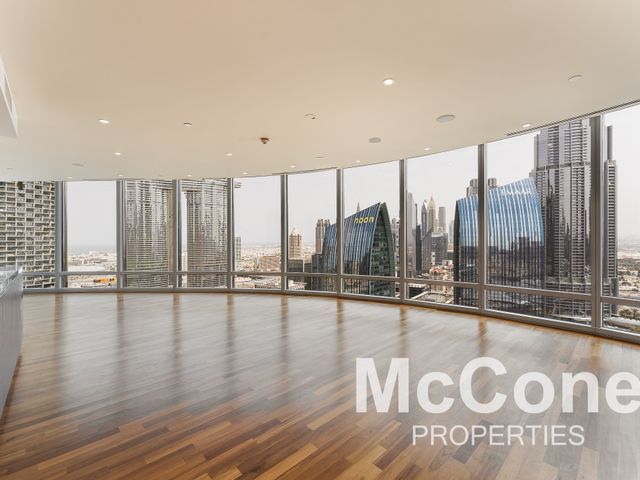
AED 539,989/ year
5 bath · 2,333 sqft · Panoramic View · 3+Maids+Study · Vacant
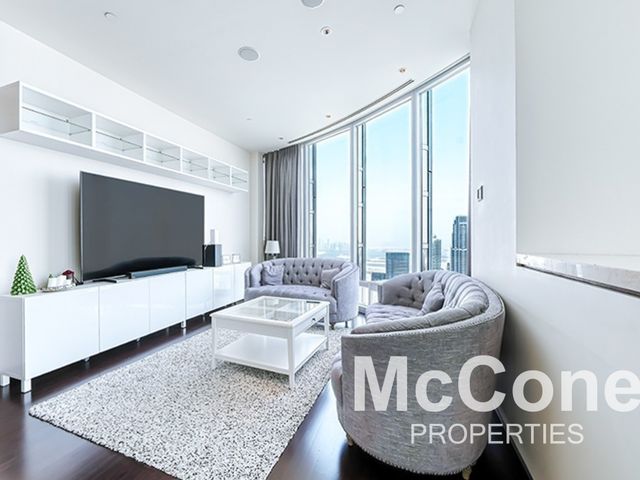
AED 460,000/ year
3 bath · 2,036 sqft · Fountain Views · High Floor · Panoramic Views
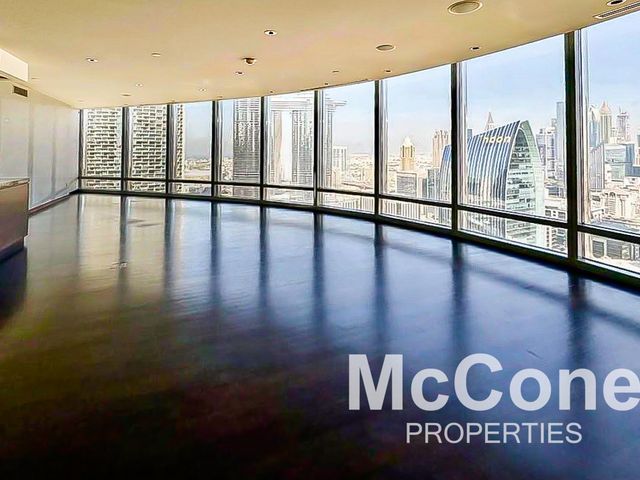
AED 399,000/ year
3 bath · 2,056 sqft · Luxury Living · Large Layout · Vacant
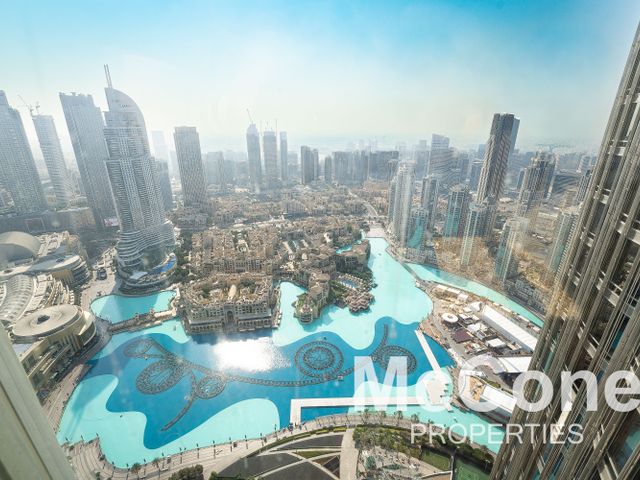
AED 347,995/ year
3 bath · 1,716 sqft · Spacious · Fountain View · Above Level
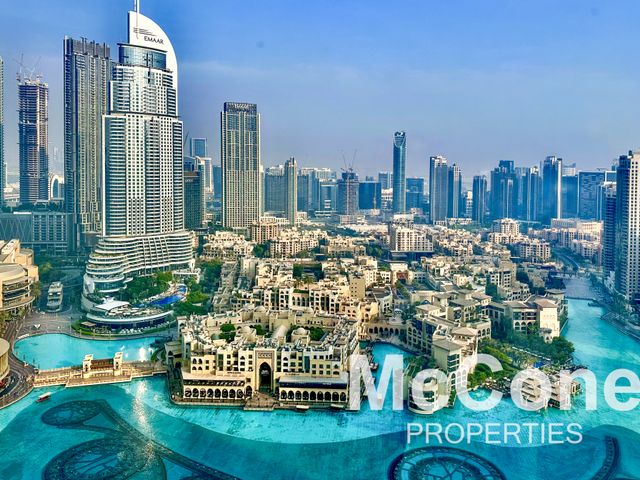
AED 330,000/ year
3 bath · 1,639 sqft · Fountain View · Single Lift · Exclusive
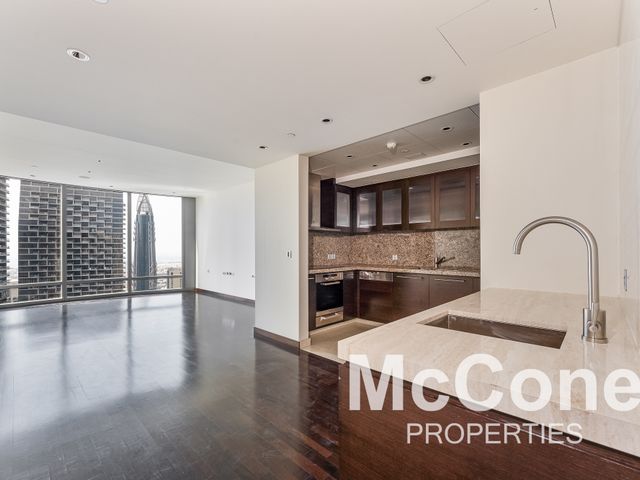
AED 220,000/ year
2 bath · 1,133 sqft · Vacant · Large Unit · Opera View
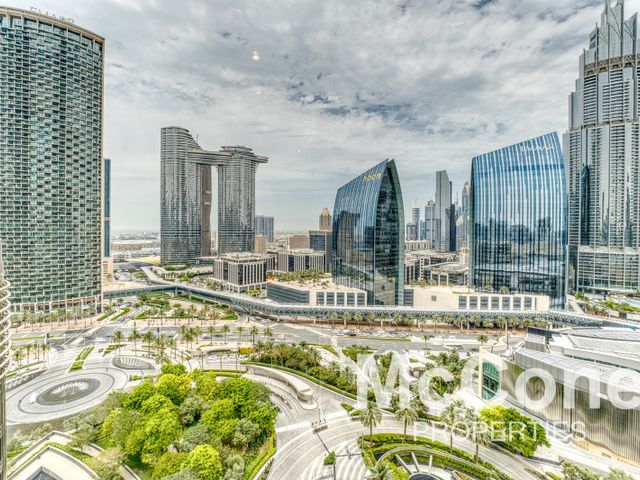
AED 195,000/ year
1 bath · 1,103 sqft · Vacant · Video Available · Low-Mid Floor
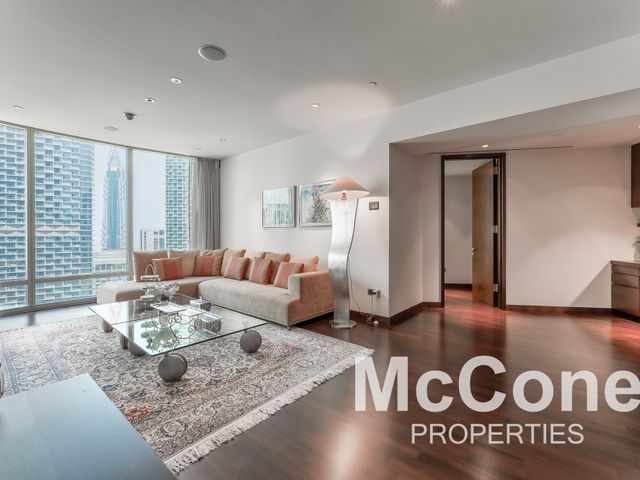
AED 190,000/ year
1 bath · 1,103 sqft · Fountain + Boulevard View · High Floor
Burj Khalifa — 2 B/R median AED 285,000 a year, AED 164 a sq ft, from 318 Ejari contracts in 12 months; gross yield 5.2% (2 B/R). 9 for rent with McCone, AED 190K – 540K / year. 6 for sale →
Your agent in Burj Khalifa

Senior Luxury Sales
Renting in Burj Khalifa? Will can walk you through what these numbers mean for you.
Will is marketing 3 homes for rent in Burj Khalifa right now.
Every recorded sale in Burj Khalifa — prices, sizes and the year it was handed over →
How Burj Khalifa compares — every tower in Downtown Dubai, ranked by recorded price →
Living in Downtown Dubai — the area guide →
What a home in Burj Khalifa returns on its rent — the yield calculator →
Recorded rents
Tenancies registered with Ejari that name Burj Khalifa, last twelve months. Annual rents, medians.
| Layout | Typical size | Median rent | Mean rent | Per sq ft / year | Contracts |
|---|---|---|---|---|---|
| Studio | 546 sqft | 110,000 | 110,950 | 201 | 10 |
| 1 B/R | 1,103 sqft | 185,000 | 186,270 | 165 | 126 |
| 2 B/R | 1,888 sqft | 285,000 | 307,370 | 155 | 145 |
| 3 B/R | 2,663 sqft | 450,000 | 468,349 | 170 | 32 |
| 4 B/R | 4,493 sqft | 1,000,000 | 1,350,000 | 234 | 5 |
Layouts with fewer than five contracts in the year are left out. 1,177 contracts name this building on the register since 2023.
For comparison
How Burj Khalifa sits against its community. The full Downtown Dubai rental report →
| Layout | Median rent | Mean rent | New lease | Renewal | Per sq ft / year | Contracts |
|---|---|---|---|---|---|---|
| Studio | 70,189 | 76,523 | 70,000 | 75,000 | 142 | 637 |
| 1 B/R | 113,700 | 117,001 | 112,000 | 115,000 | 128 | 4,060 |
| 2 B/R | 175,000 | 188,848 | 180,000 | 170,768 | 131 | 3,417 |
| 3 B/R | 280,000 | 294,285 | 297,000 | 270,000 | 146 | 1,051 |
| 4 B/R | 1,300,000 | 1,385,357 | 1,500,000 | 1,150,000 | 254 | 57 |
Rent against price
This building's own recorded rent per square foot a year over its own recorded resale price per square foot, layout by layout.
| Layout | Rent / sq ft / year | Rent from | Sale / sq ft | Gross yield |
|---|---|---|---|---|
| 1 B/R | 165 | This building · 126 | 2,775 | 6% |
| 2 B/R | 155 | This building · 145 | 3,009 | 5.2% |
| 3 B/R | 170 | This building · 32 | 3,215 | 5.3% |
| 4 B/R | 234 | This building · 5 | 3,257 | 7.2% |
Gross: before service charges, agency fees and any months empty between tenants. The sale side is completed homes sold here in the last three years, five or more of a layout.
Every tenancy, as registered
The latest tenancies registered with Ejari naming this building, newest first.
| Start | Layout | Size | Annual rent | Type |
|---|---|---|---|---|
| 26 Oct 2026 | 2 B/R | 1,546 | 233,000 | New lease |
| 25 Oct 2026 | 1 B/R | 1,096 | 195,000 | Renewal |
| 22 Oct 2026 | 1 B/R | 1,098 | 160,000 | New lease |
| 19 Oct 2026 | 2 B/R | 2,033 | 270,000 | Renewal |
| 17 Oct 2026 | 1 B/R | 1,096 | 157,000 | New lease |
| 17 Oct 2026 | 2 B/R | 1,778 | 275,000 | New lease |
| 17 Oct 2026 | 2 B/R | 1,778 | 275,000 | Renewal |
| 17 Oct 2026 | 2 B/R | 1,926 | 450,000 | Renewal |
| 17 Oct 2026 | 1 B/R | 1,103 | 200,000 | New lease |
| 16 Oct 2026 | 1 B/R | 1,182 | 259,000 | New lease |
| 15 Oct 2026 | 1 B/R | 1,185 | 190,000 | New lease |
| 14 Oct 2026 | 2 B/R | 2,203 | 355,000 | Renewal |
How often it lets
New tenancies and renewals naming Burj Khalifa, stacked.New leaseRenewal
249 contracts in 2026 so far. The 2026 bar is part-year.
For rent nearby · Downtown Dubai
Our live rental stock in the community. Everything for rent in Downtown Dubai →
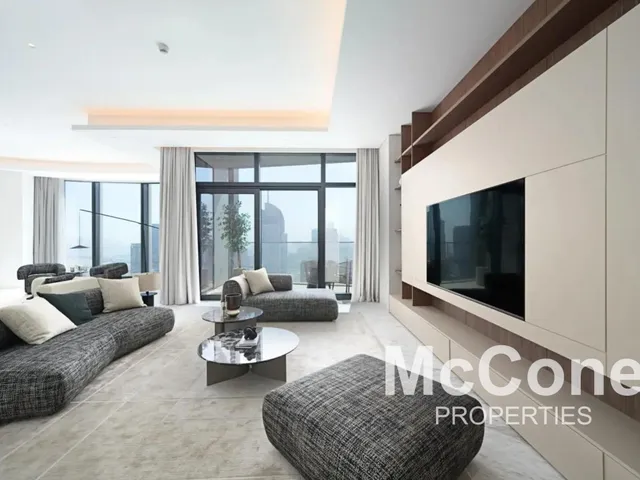
AED 2,000,000/ year
5 bath · 5,300 sqft · Burj and Fountain View · 02 Layout · Ultra Luxury
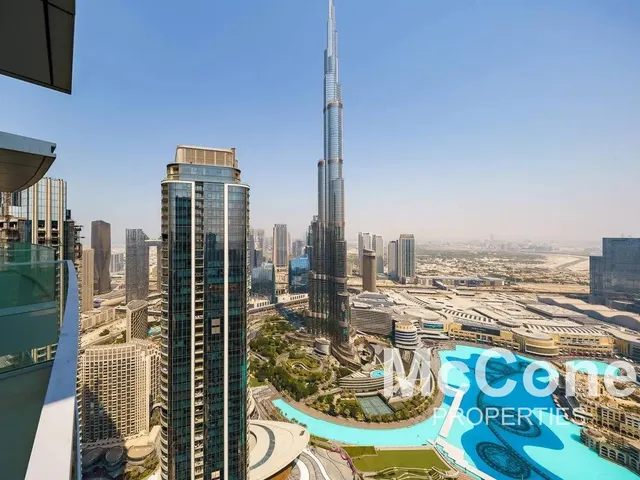
AED 1,800,000/ year
6 bath · 7,454 sqft · Penthouse Luxury Furnished · Burj & Fountain View
AED 1,800,000/ year
6 bath · 6,593 sqft · Penthouse Luxury Furnished · Burj & Fountain View
AED 1,549,990/ year
5 bath · 5,176 sqft · Brand New · High Floor · Penthouse
AED 1,400,000/ year
6 bath · 5,176 sqft · Burj Fountain · Exclusive · 02 · Multiple Options
AED 1,000,000/ year
5 bath · 3,693 sqft · Burj View · Penthouse · Mall Access
Nearby
The buildings this one sits between on recorded price per square foot, and the newest to start trading. Every one has its own page of registered prices.
| Building | Recorded sales | First traded | Median per sq ft |
|---|---|---|---|
| Inaura Hotels & Residencesnewest | 35 | 2026 | 4,989 |
| Binghatti Skybladenewest | 566 | 2025 | 3,909 |
| Society House | 401 | 2023 | 2,834 |
| Downtown Dubai One Residence | 361 | 2024 | 2,829 |
| The St. Regis Residences - Tower 2 | 617 | 2022 | 2,738 |
| Zaafaran 5 | 41 | 2009 | 2,689 |
| Volta | 430 | 2023 | 2,615 |
| The Dubai Mall Residences | 1,181 | 2007 | 2,572 |
| Elegance Tower | 311 | 2022 | 2,566 |
| City Center Residences | 558 | 2022 | 2,554 |
Medians over each building’s whole recorded history at the Dubai Land Department, so a tower that has not traded lately is still here — this is what to look at next, not what the market is doing this month. Buildings with fewer than five recorded sales are left out. “First traded” is the year the register first saw a sale in the building, which for a new tower is close to its handover.
Moving into Burj Khalifa? Ejari, the DEWA move-in and your Makani number, explained.